📊 Kubernetes Monitoring Using Coralogix
👁️ Observability Into K8s Platform
Kubernetes has been out there for a while, and companies use it heavily to deploy and release their applications faster to market. The platform offers scalability, recovery of pods, etc.
But one area that has been of constant struggle, i.e. platform observability.
When a worker node goes down, and say there aren’t any more nodes available, then the applications on that node are impacted, causing some business impact. There are many tools available out there in the market, but I stumbled upon Coralogix.
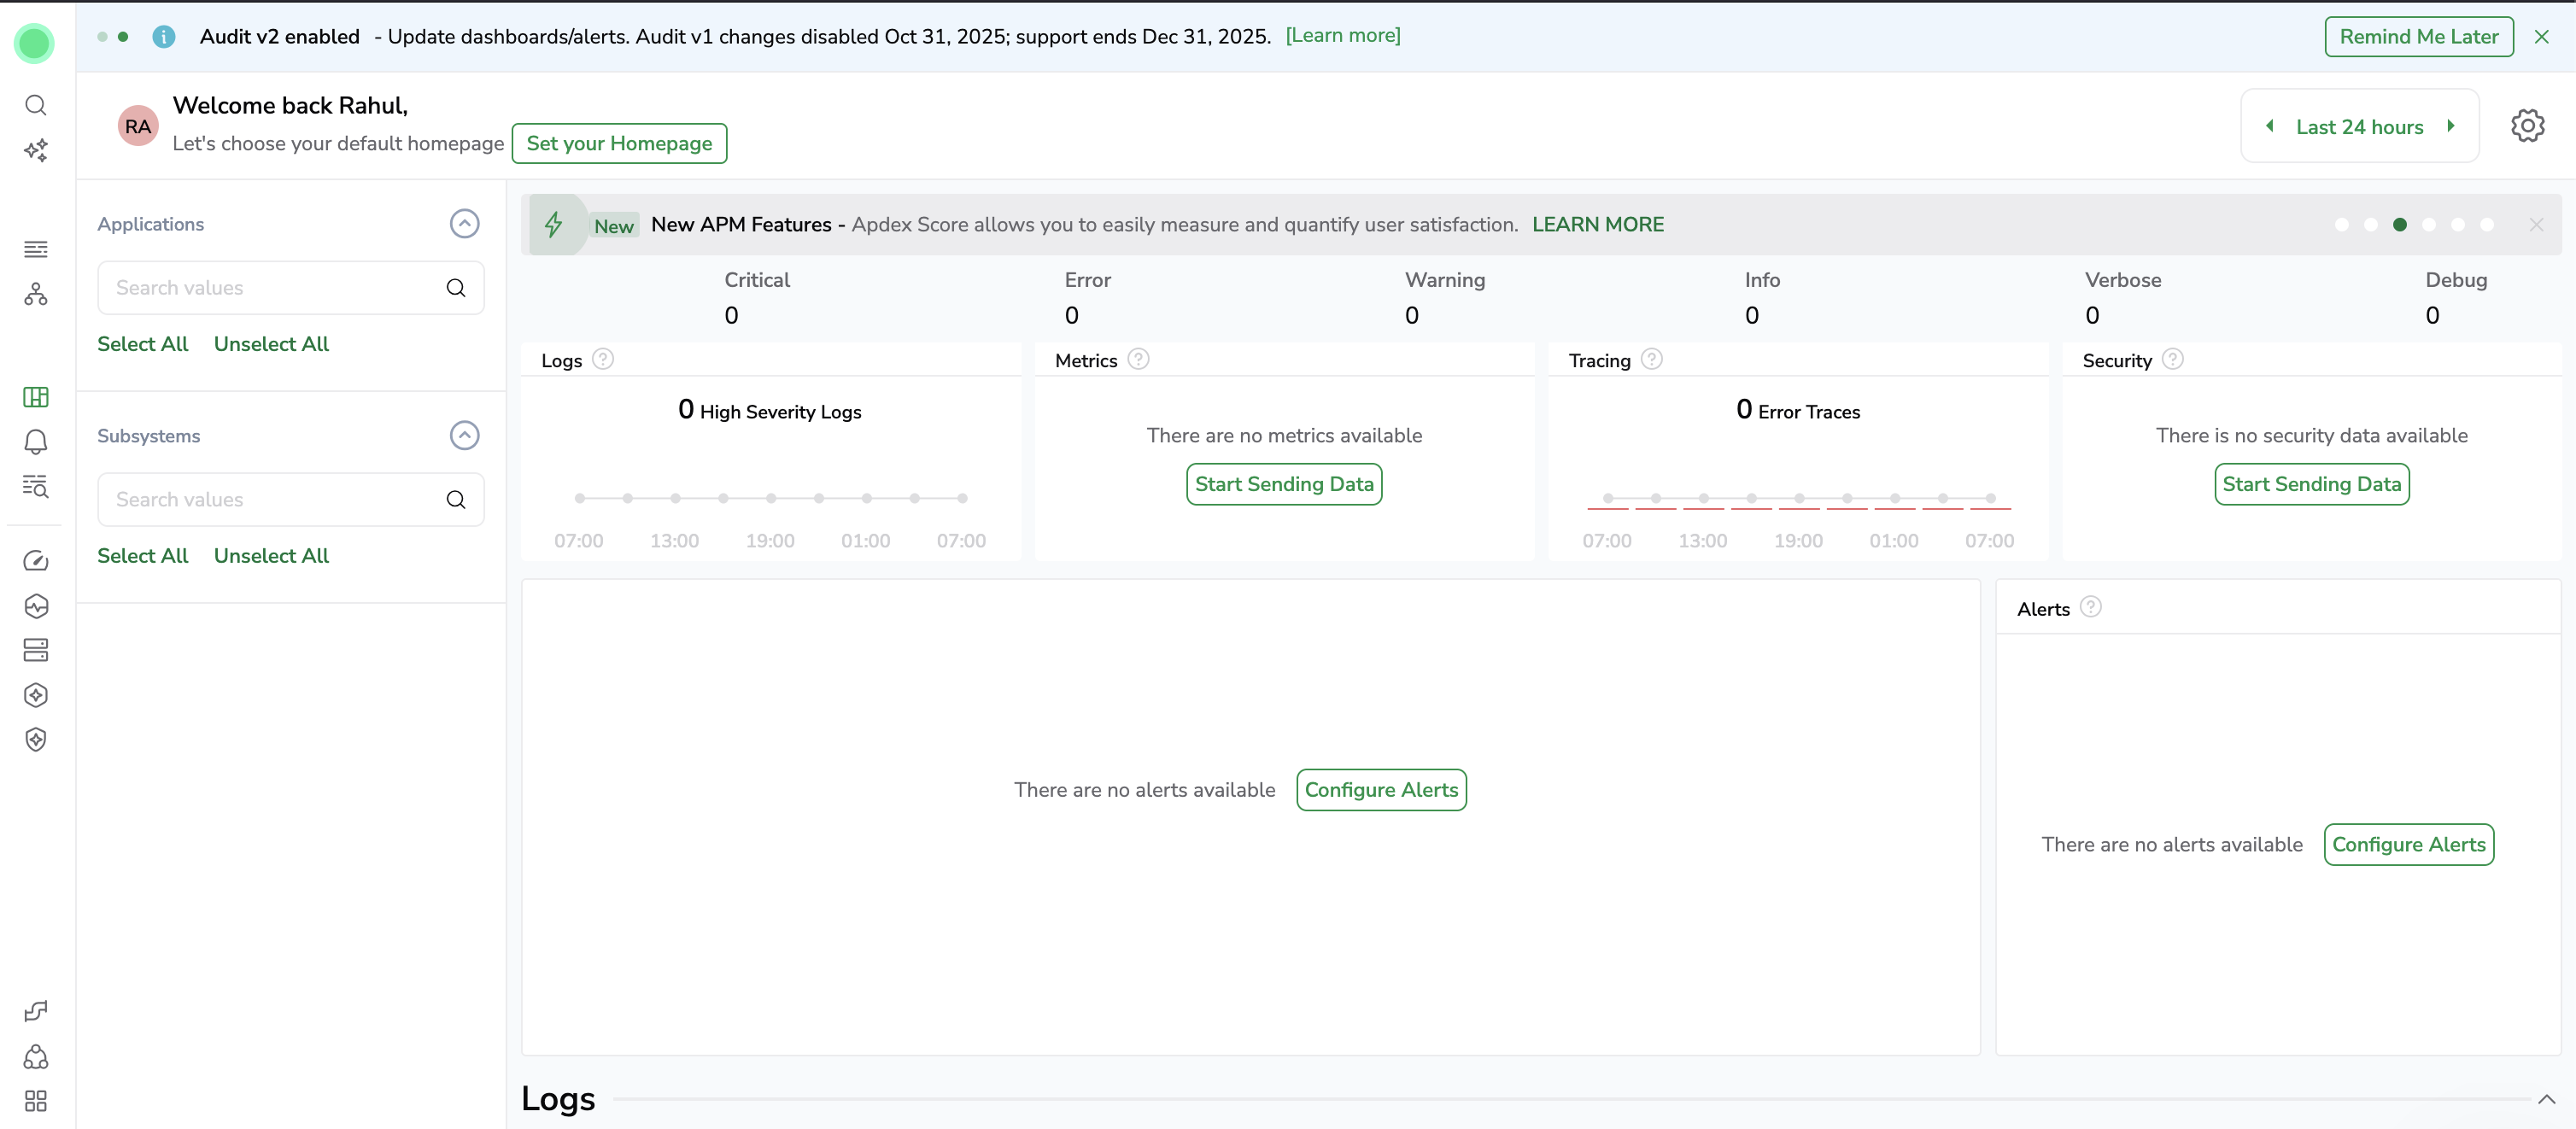
The company has been working on making things simple for platform operators to know all about their k8s environment, pods and services running on it. It streams logs and users can have a better idea of what is going on within their namespace and applications.
It generates topologies for all the service to service dependencies.
Applications can send their metrics to the platform, and have better visibility in the same platform.
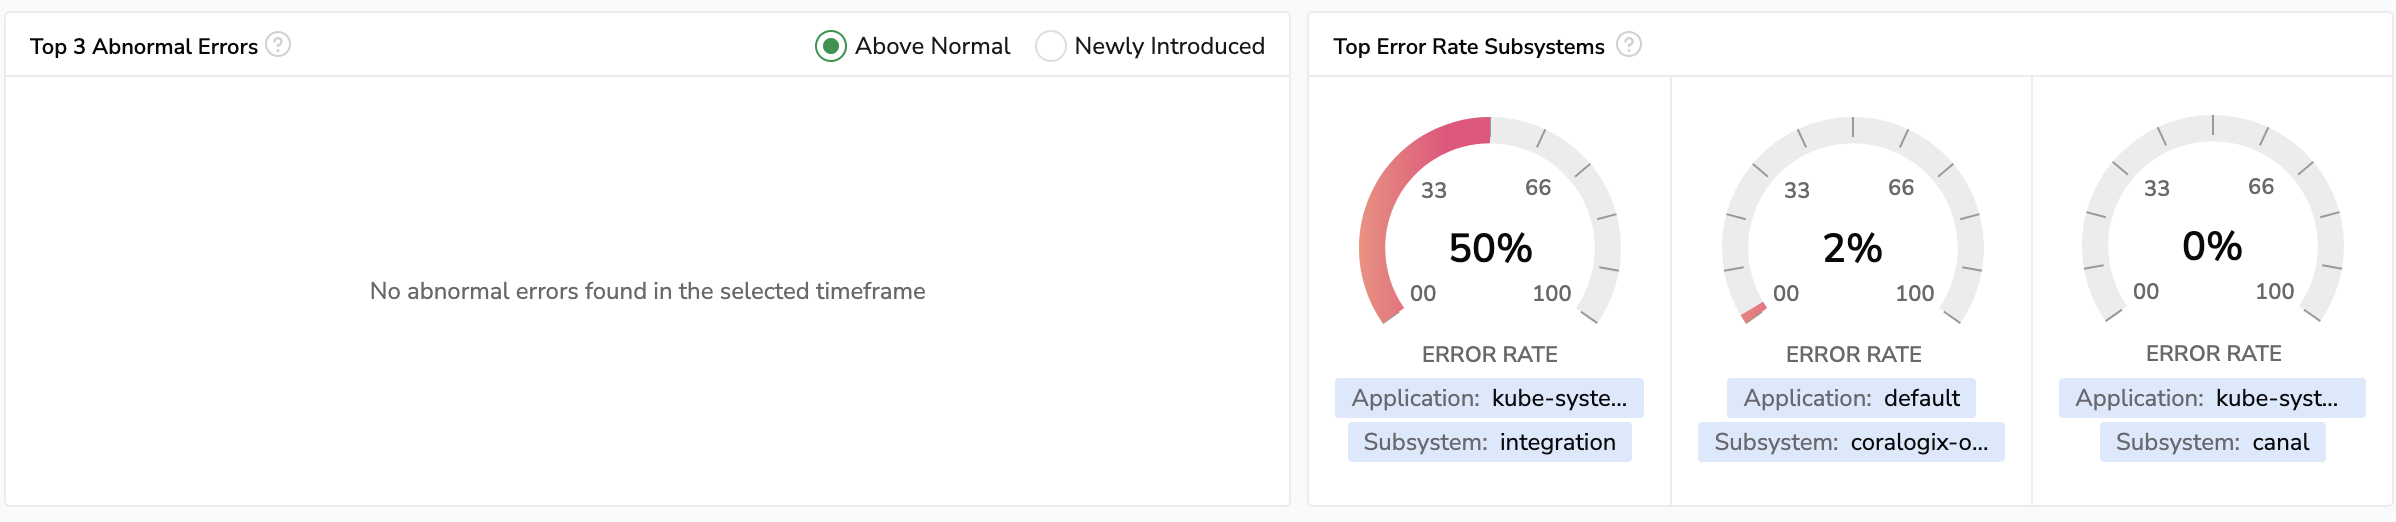
Screenshot of the coralogix platform. Looks neat!
Setup of collector to monitor my k8s running on Raspberry Pi
To setup, I need to first generate a API key to allow k8s to send data to Coralogix. This is done by going into Data Flow > Integrations > Kubernetes Complete Observability
Here it walks through each step. So once you have the API keys available, its time to setup the collector using helm charts.
helm repo add coralogix https://cgx.jfrog.io/artifactory/coralogix-charts-virtual
helm repo update
Create a namespace and create the secret (using the api key)
kubectl create namespace default
kubectl create secret generic coralogix-keys --namespace default  --from-literal=PRIVATE_KEY="<key-value>"
Finally install the collector
helm upgrade --install otel-coralogix-integration coralogix/otel-integration --version=0.0.229 --namespace default --render-subchart-notes -f ~/Downloads/values.yaml
Release "otel-coralogix-integration" does not exist. Installing it now.
NAME: otel-coralogix-integration
LAST DEPLOYED: Fri Oct 16 07:49:59 2025
NAMESPACE: default
STATUS: deployed
REVISION: 1
TEST SUITE: None
NOTES:
** NOTE: Ensure you have the correct domain and the cluster name in the value.yaml **
global:
  domain: eu2.coralogix.com
  clusterName: demo-pi
Let’s list all the pods
k get po
NAME                                                 READY   STATUS    RESTARTS   AGE
coralogix-opentelemetry-agent-d9hht                  1/1     Running   0          73s
coralogix-opentelemetry-agent-dqgv4                  1/1     Running   0          73s
coralogix-opentelemetry-agent-psf8v                  1/1     Running   0          73s
coralogix-opentelemetry-agent-r9xk9                  1/1     Running   0          73s
coralogix-opentelemetry-collector-69d9959d89-2l2jx   1/1     Running   0          73s
If the integration is a success, you will notice that the logs begin to show up on coralogix.com portal
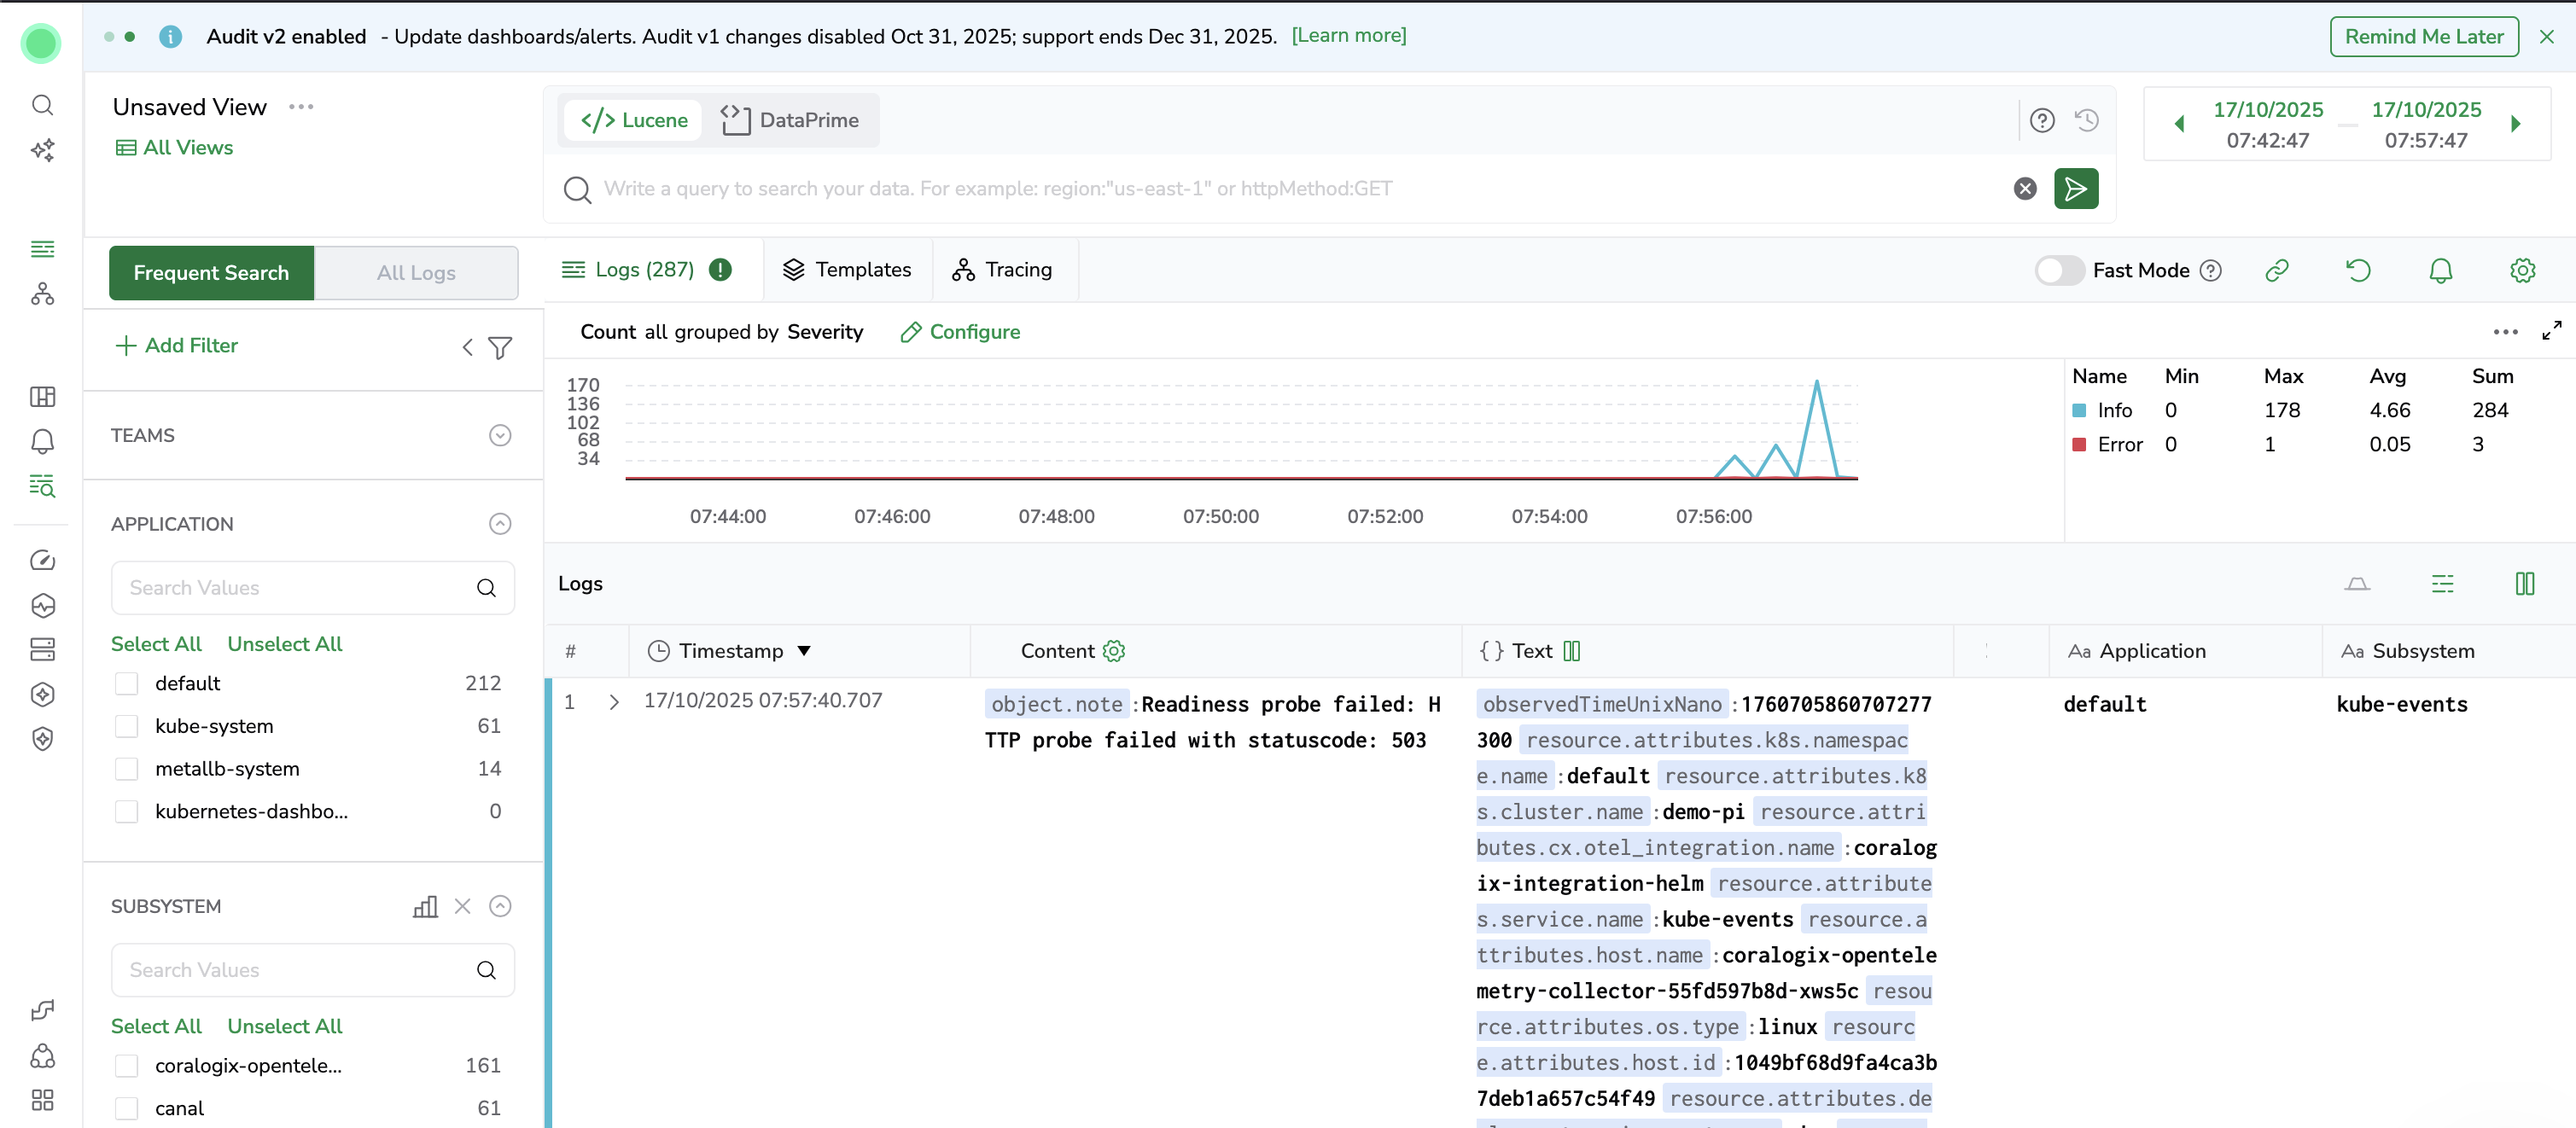
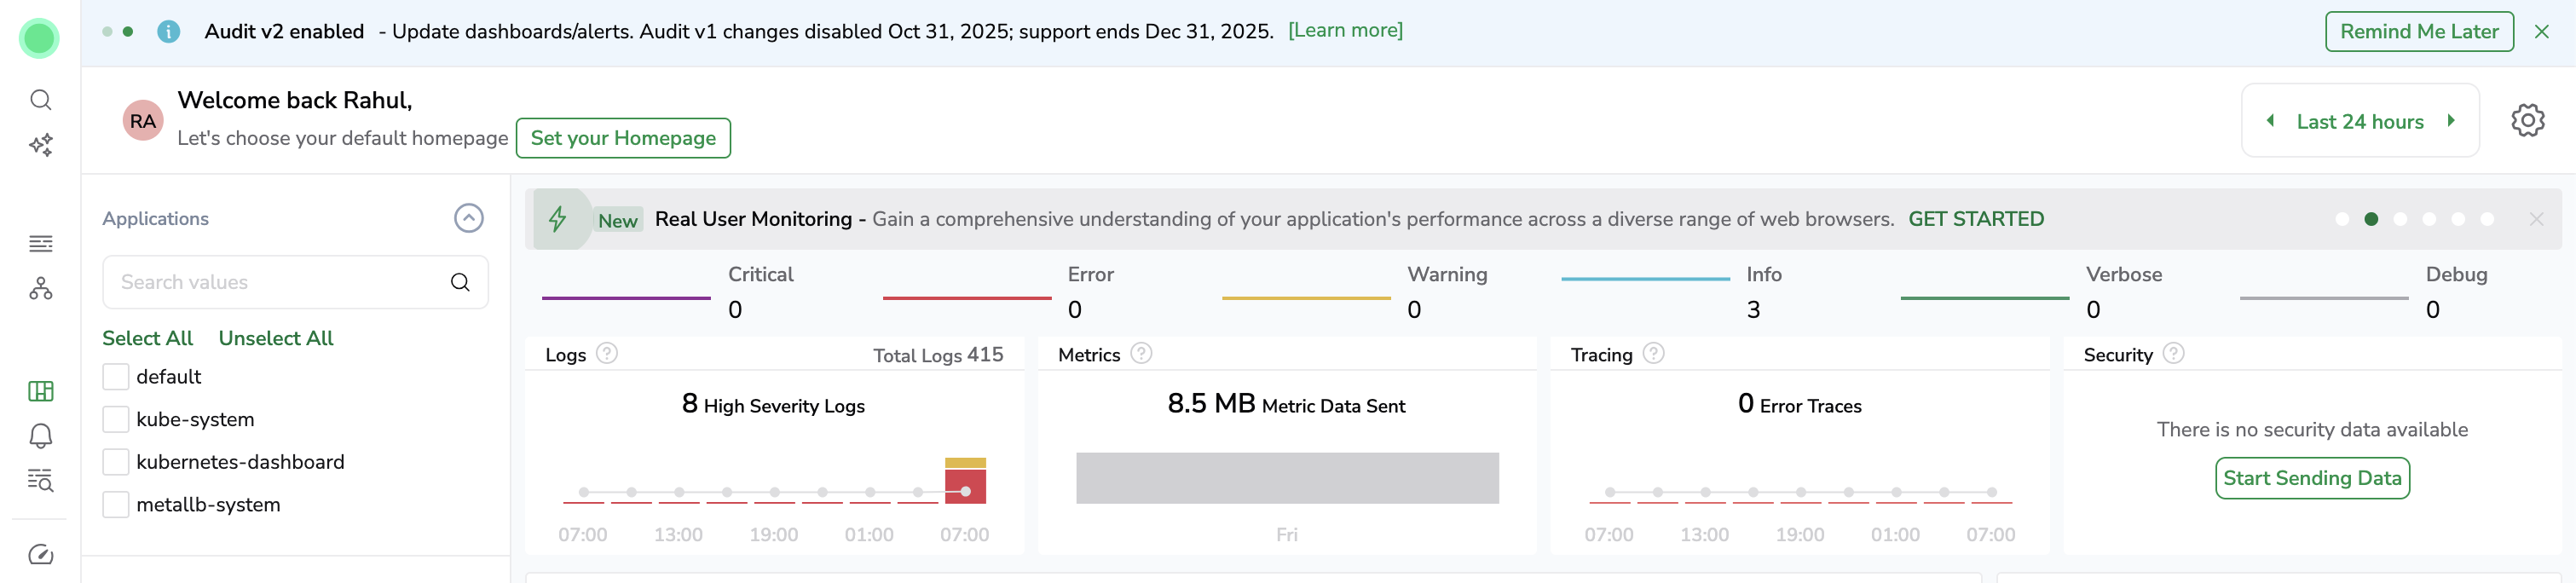
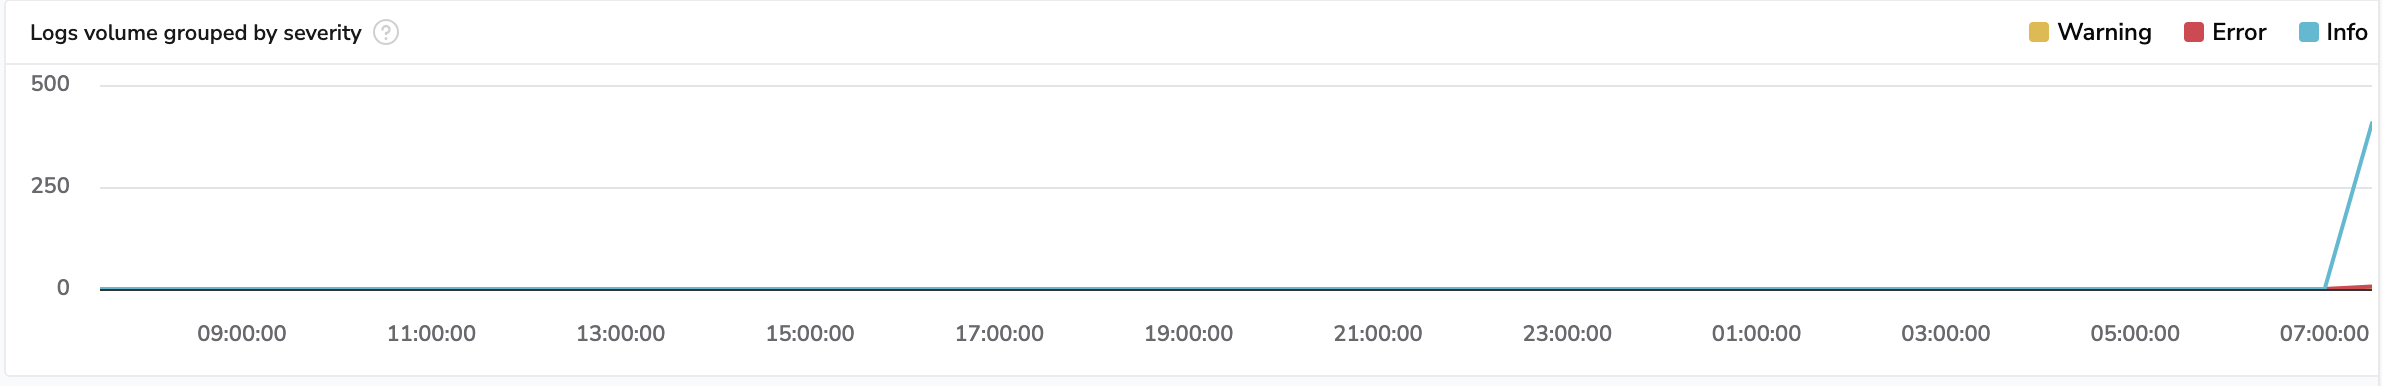
Wow, that was quick. Let’s look at the dashboard
Now why choose Coralogix?
- Its simple to setup. Loads of integrations are available and the console provides a lot of step by step instructions to setup the collectors.
- Very easy to use, as the platform comes with pre-built dashboards, that can be customized to cater specific business needs.
- Has integrations with a lot of OSS frameworks
- Alertmanagers are available, and you can send notifications too
I’m yet to explore a lot more about this product, but seems like its fairly easy to use and solves a lot of platform operators challenges.
Keep learning and keep sharing.